From thumbtacks to pixels, crime mapping for investigations has evolved with technology, but its purpose and resulting answers remains the same.
Investigative mapping has fundamentally changed investigations. This process—visually representing spatial data to understand crime patterns—has evolved from a laborious manual task to a powerful, technology-driven tool. It now enables efficient resource allocation, accelerates timelines, and improves the tracking of criminal behavior. With the advent of these technologies, maps are plotted with more accuracy than hand-drawn maps of the past.
The Historical Context: Manual Mapping and its Limitations
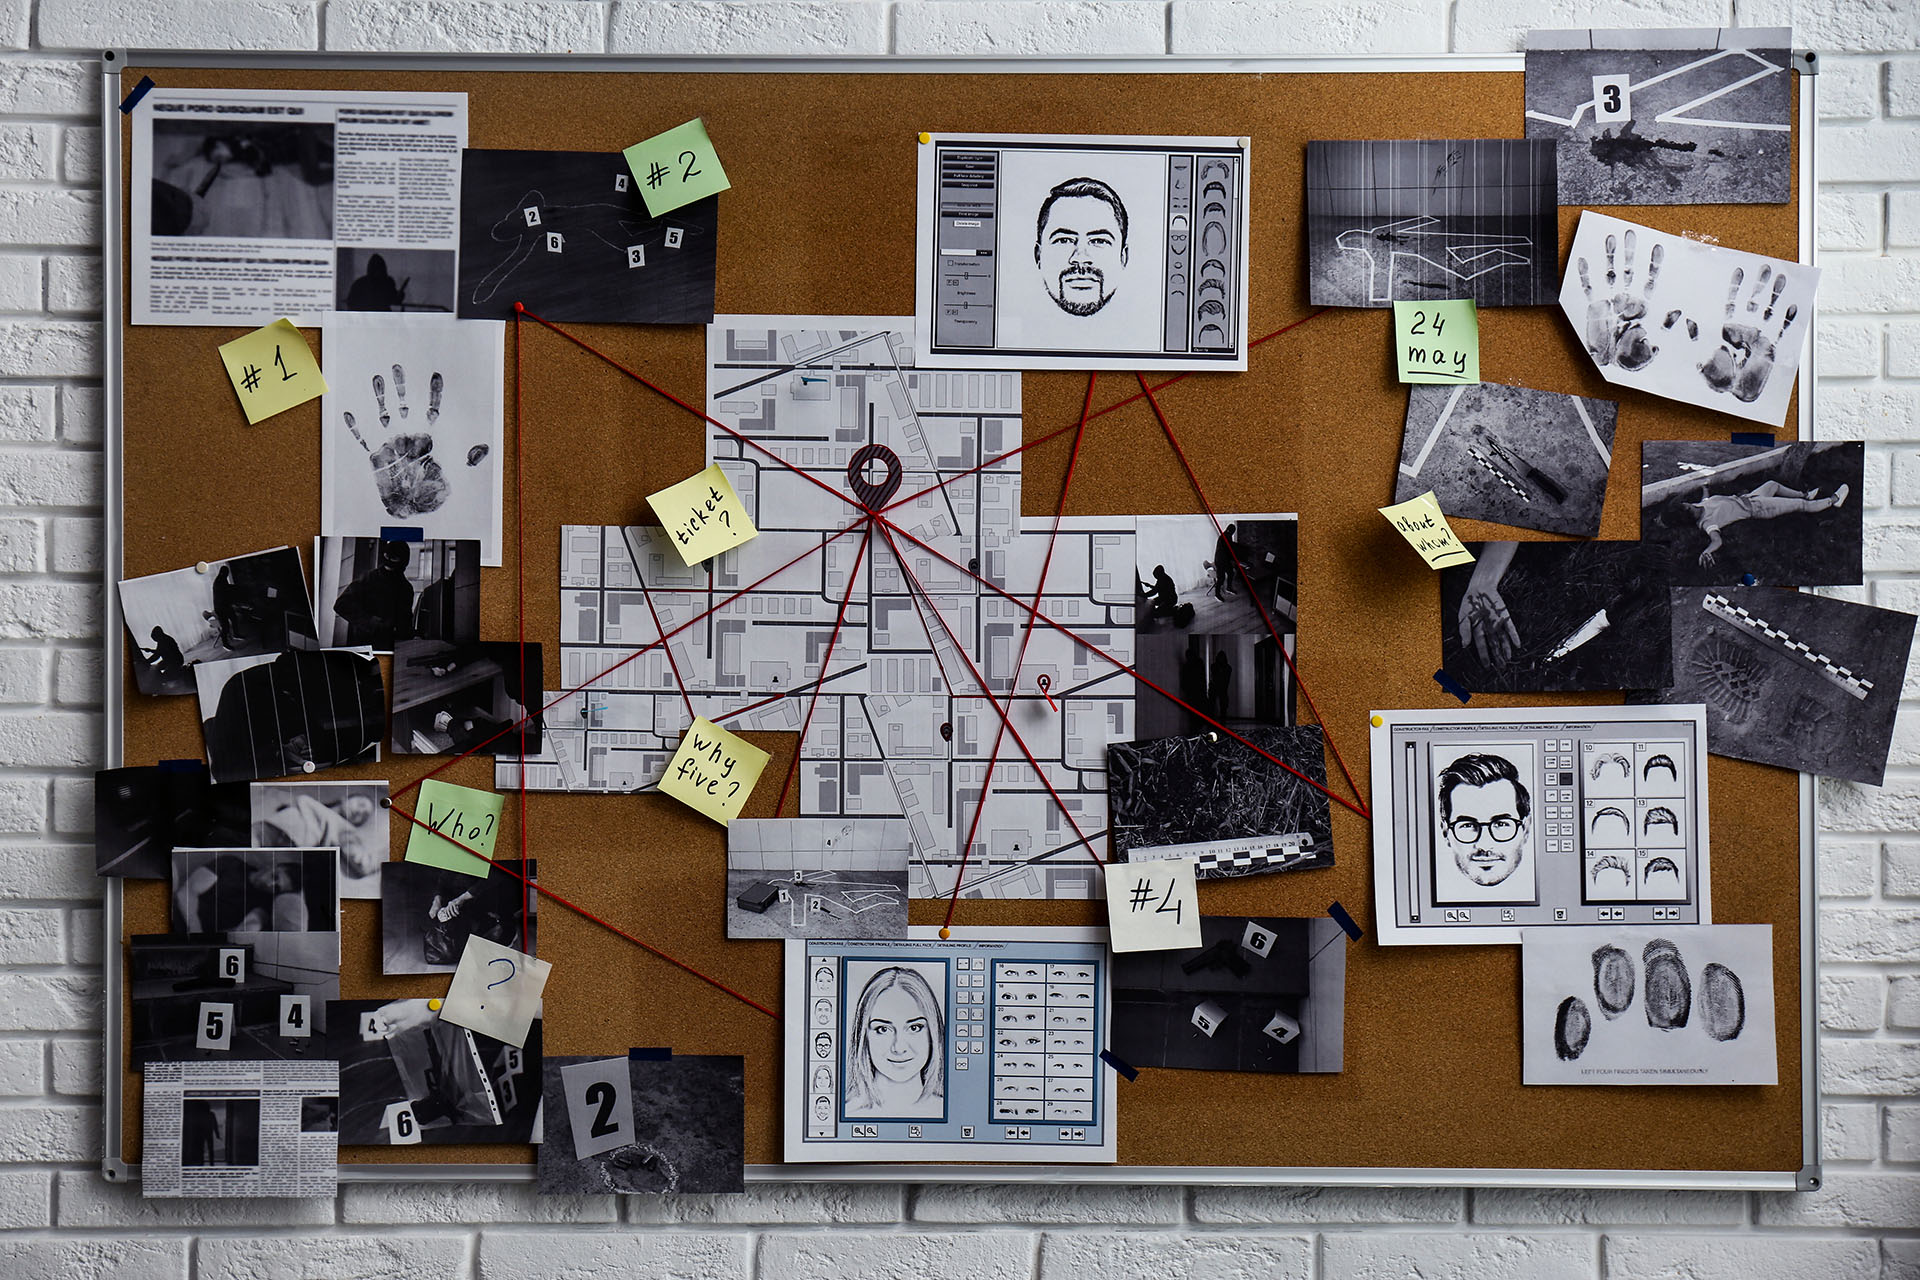
 Traditional investigative mapping relied on hand-drawn or published city maps, often large-scale, posted on walls or cork boards. Investigators marked key locations with thumbtacks or pins, sometimes using string to connect them and visualize relationships like direction of travel or possible meetups of associates. This process was time-consuming, sometimes taking days to create, update, and refine a single map. Manual methods were inherently prone to error; precise location reporting was difficult, and hand-calculated pattern analysis introduced human error. Large datasets, particularly ones with complex relationships laid out with overlapping pins and strings, presented a significant challenge. Any geographic changes or case updates required redoing entire maps. Furthermore, sharing information in multi-agency investigations was difficult, as maps were typically limited to a single location complicating effective communication and requiring travel to see in person.
The Technological Revolution: Digital Mapping and its Impact
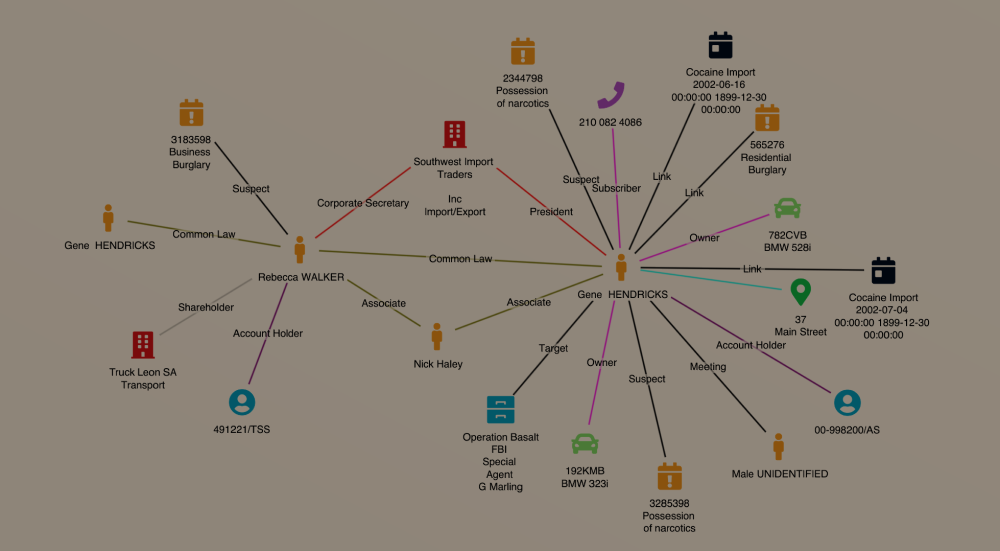
The advent of Geographic Information Systems (GIS) revolutionized crime mapping, transforming it from a static, manual process to a dynamic, analytical tool. Prior to GIS, investigators were limited in analyzing complex patterns. GIS enabled the creation of interactive digital maps that could be easily updated and visually captures multiple datasets simultaneously, including topology, environmental factors, and infrastructure information. This data integration, coupled with powerful spatial analysis tools, allowed for the identification of crime hotspots, the tracking of evolving patterns, and a deeper understanding of the context surrounding criminal activity. With this new technology available, maps could be disseminated with ease allowing for increased communication across multiple locations. Data entry and spatial analysis could now be conducted in shorter amounts of time and immediately placed on a map data layer, and with higher accuracy and precision. GIS and mapping software allow for real-time updates, visualizations of complex data relationships, and pattern analysis that are inconsistent and unreliable to do manually.
Tracking Criminal Behavior: Unveiling Patterns and Connections
Mapping allows investigators to visually represent crime incidents, revealing patterns and hotspots that might be missed when the data is captured in spreadsheets or other list forms. This could be anything from a series of burglaries in a specific neighborhood to the movement patterns of a violent offender. By overlaying crime data with other geographic information (e.g., roads, businesses, schools), investigators can understand the context of criminal activity. This helps identify factors that contribute to crime, such as proximity to highways or the presence of certain types of establishments.
In cases involving serial crimes, mapping can help narrow down the search area for suspects. By analyzing the locations of crime scenes, investigators can make inferences about the offender’s likely residence or workplace. Crime maps help police departments allocate resources more effectively. By identifying high-crime areas, they can deploy patrols and other resources where they are most needed, maximizing their impact. Mapping provides the data necessary to develop targeted crime prevention strategies. For example, if a map reveals a cluster of robberies near a particular bus stop, the police can increase patrols in that area or work with the transit authority to improve lighting and security.
Analyzing crime trends over time and space is crucial for effective policing. While identifying high-crime areas is helpful, understanding when those crimes occur is essential for targeted intervention. Mapping allows visualization of these dynamics, revealing how crime patterns evolve and shift. Techniques like animated maps and time-series analysis with spatial data help investigators identify statistically significant changes in crime levels over time within specific areas. This combined analysis informs real-world applications, such as predictive policing, resource allocation, and evaluation of crime prevention strategies.
The power of visualizing crime data lies in its ability to reveal hidden patterns. Crimes that appear unrelated in isolation, like a series of burglaries spread across a city, can reveal a clear connection when plotted on a map. For instance, mapping these burglaries might show clustering along a transportation corridor. This visual representation allows investigators to uncover connections difficult to discern from traditional reports, linking seemingly unrelated incidents and generating valuable leads. It allows them to see beyond individual crimes and identify broader criminal networks or patterns of activity. Manual mapping makes such comprehensive analysis impractical.
Resource Allocation: Optimizing Deployment and Prevention
Administrative uses for mapping are also beneficial for strategically allocating resources. By visualizing crime patterns and hotspots, police departments can identify areas with the highest need for intervention and concentrate their efforts accordingly. Efforts such as increasing patrols in high-crime zones, deploying specialized units to address specific crime types, or strategically placing community outreach programs to address root causes. Mapping also helps optimize response times by identifying the most efficient routes for patrol cars and strategically positioning police stations or substations.
Mapping can illuminate environmental factors contributing to crime by visually correlating crime hotspots with geographic features like poorly lit areas, vacant lots, or the proximity of certain establishments. This spatial analysis targets interventions, such as improved lighting, urban renewal projects, or regulation of businesses, to address these environmental risk factors and prevent future criminal activity.
From Days to Seconds: The Power of Coding and Automation
 Coding and scripting have become indispensable for modern crime mapping. They empower law enforcement to tailor digital mapping tools to their precise requirements for crime prevention, investigation, and resource allocation. This customization allows for a range of benefits. Time-consuming tasks, like importing and cleaning crime data, can be automated, freeing up valuable time. Complex spatial relationships can be analyzed using custom geoprocessing tools, enabling investigators to identify crime patterns near specific infrastructure or even calculate the probability of future crime. Interactive web maps, accessible to officers in the field, provide real-time data and intelligence, improving situational awareness and response times. The result: map creation and statistical analysis that once took days can now be completed in seconds.
Crime mapping has dramatically evolved, transforming investigations from the labor-intensive and error-prone manual methods of the past. It has become an indispensable, technology-driven tool. While manual mapping played a role in some cases, its limitations were significant. The advent of digital mapping technologies like GIS revolutionized the field, automating tasks and enabling complex spatial analysis. This allows investigators to track criminal behavior more effectively by identifying hotspots and patterns, to allocate resources strategically by pinpointing high-crime areas, and, through coding and scripting, to reduce analysis time from days to seconds. Mapping is now crucial for improving efficiency, effectiveness, and contributing to safer communities. The future of investigative crime mapping is bright, driven by emerging technologies. Real-time crime mapping, fueled by IoT sensors and ubiquitous data collection, will provide an increasingly granular and dynamic view of criminal activity. AI and machine learning will automate pattern recognition and predictive policing, enabling investigators to anticipate and prevent crime. Integrating diverse data sources, like social media and environmental sensors, will offer a more holistic understanding of crime’s influencing factors. Virtual and augmented reality may even offer immersive environments for crime scene analysis. As these technologies mature, investigative crime mapping will become an even more powerful tool, enabling proactive policing, faster investigations, and safer communities. The principle remains: just as in the past, understanding the map’s information—its source and nature—is crucial for informed decisions.